Uptime Monitoring
Openstatus provides a global multi-cloud uptime monitoring solution.
+----------------+
| Service to be  |
| Monitored      |
+----------------+
      ▲
      |
      |   (Network Latency/Failures)
      |
+-----+-------+   +-----+-------+   +-----+-------+
| Monitoring  |   | Monitoring  |   | Monitoring  |
| Node (USA)  |   | Node (EU)   |   | Node (Asia) |
+-----+-------+   +-----+-------+   +-----+-------+
      |               |                 |
      |---------------|-----------------|
      ▼               ▼                 ▼
+------------------------------------------------+
|                 openstatus                     |
|                                                |
| - Sends automated requests (e.g., pings or     |
|   HTTP checks) from all nodes at set intervals |
| - Records response time and success/failure    |
| - Compares results from different nodes        |
| - If a failure or a slow response is detected, |
|   it triggers an alert.                        |
+------------------------------------------------+
      |
      | (Alerts: Email, SMS, Slack, etc.) 🔔
      |
+-----+-----+
| Your Team |
+-----------+
Why uptime monitoring is important?
Uptime monitoring is your first line of defense to ensure your service is available for your customers. By monitoring your service from multiple regions around the world, you can be sure that your customers are able to reach your service.
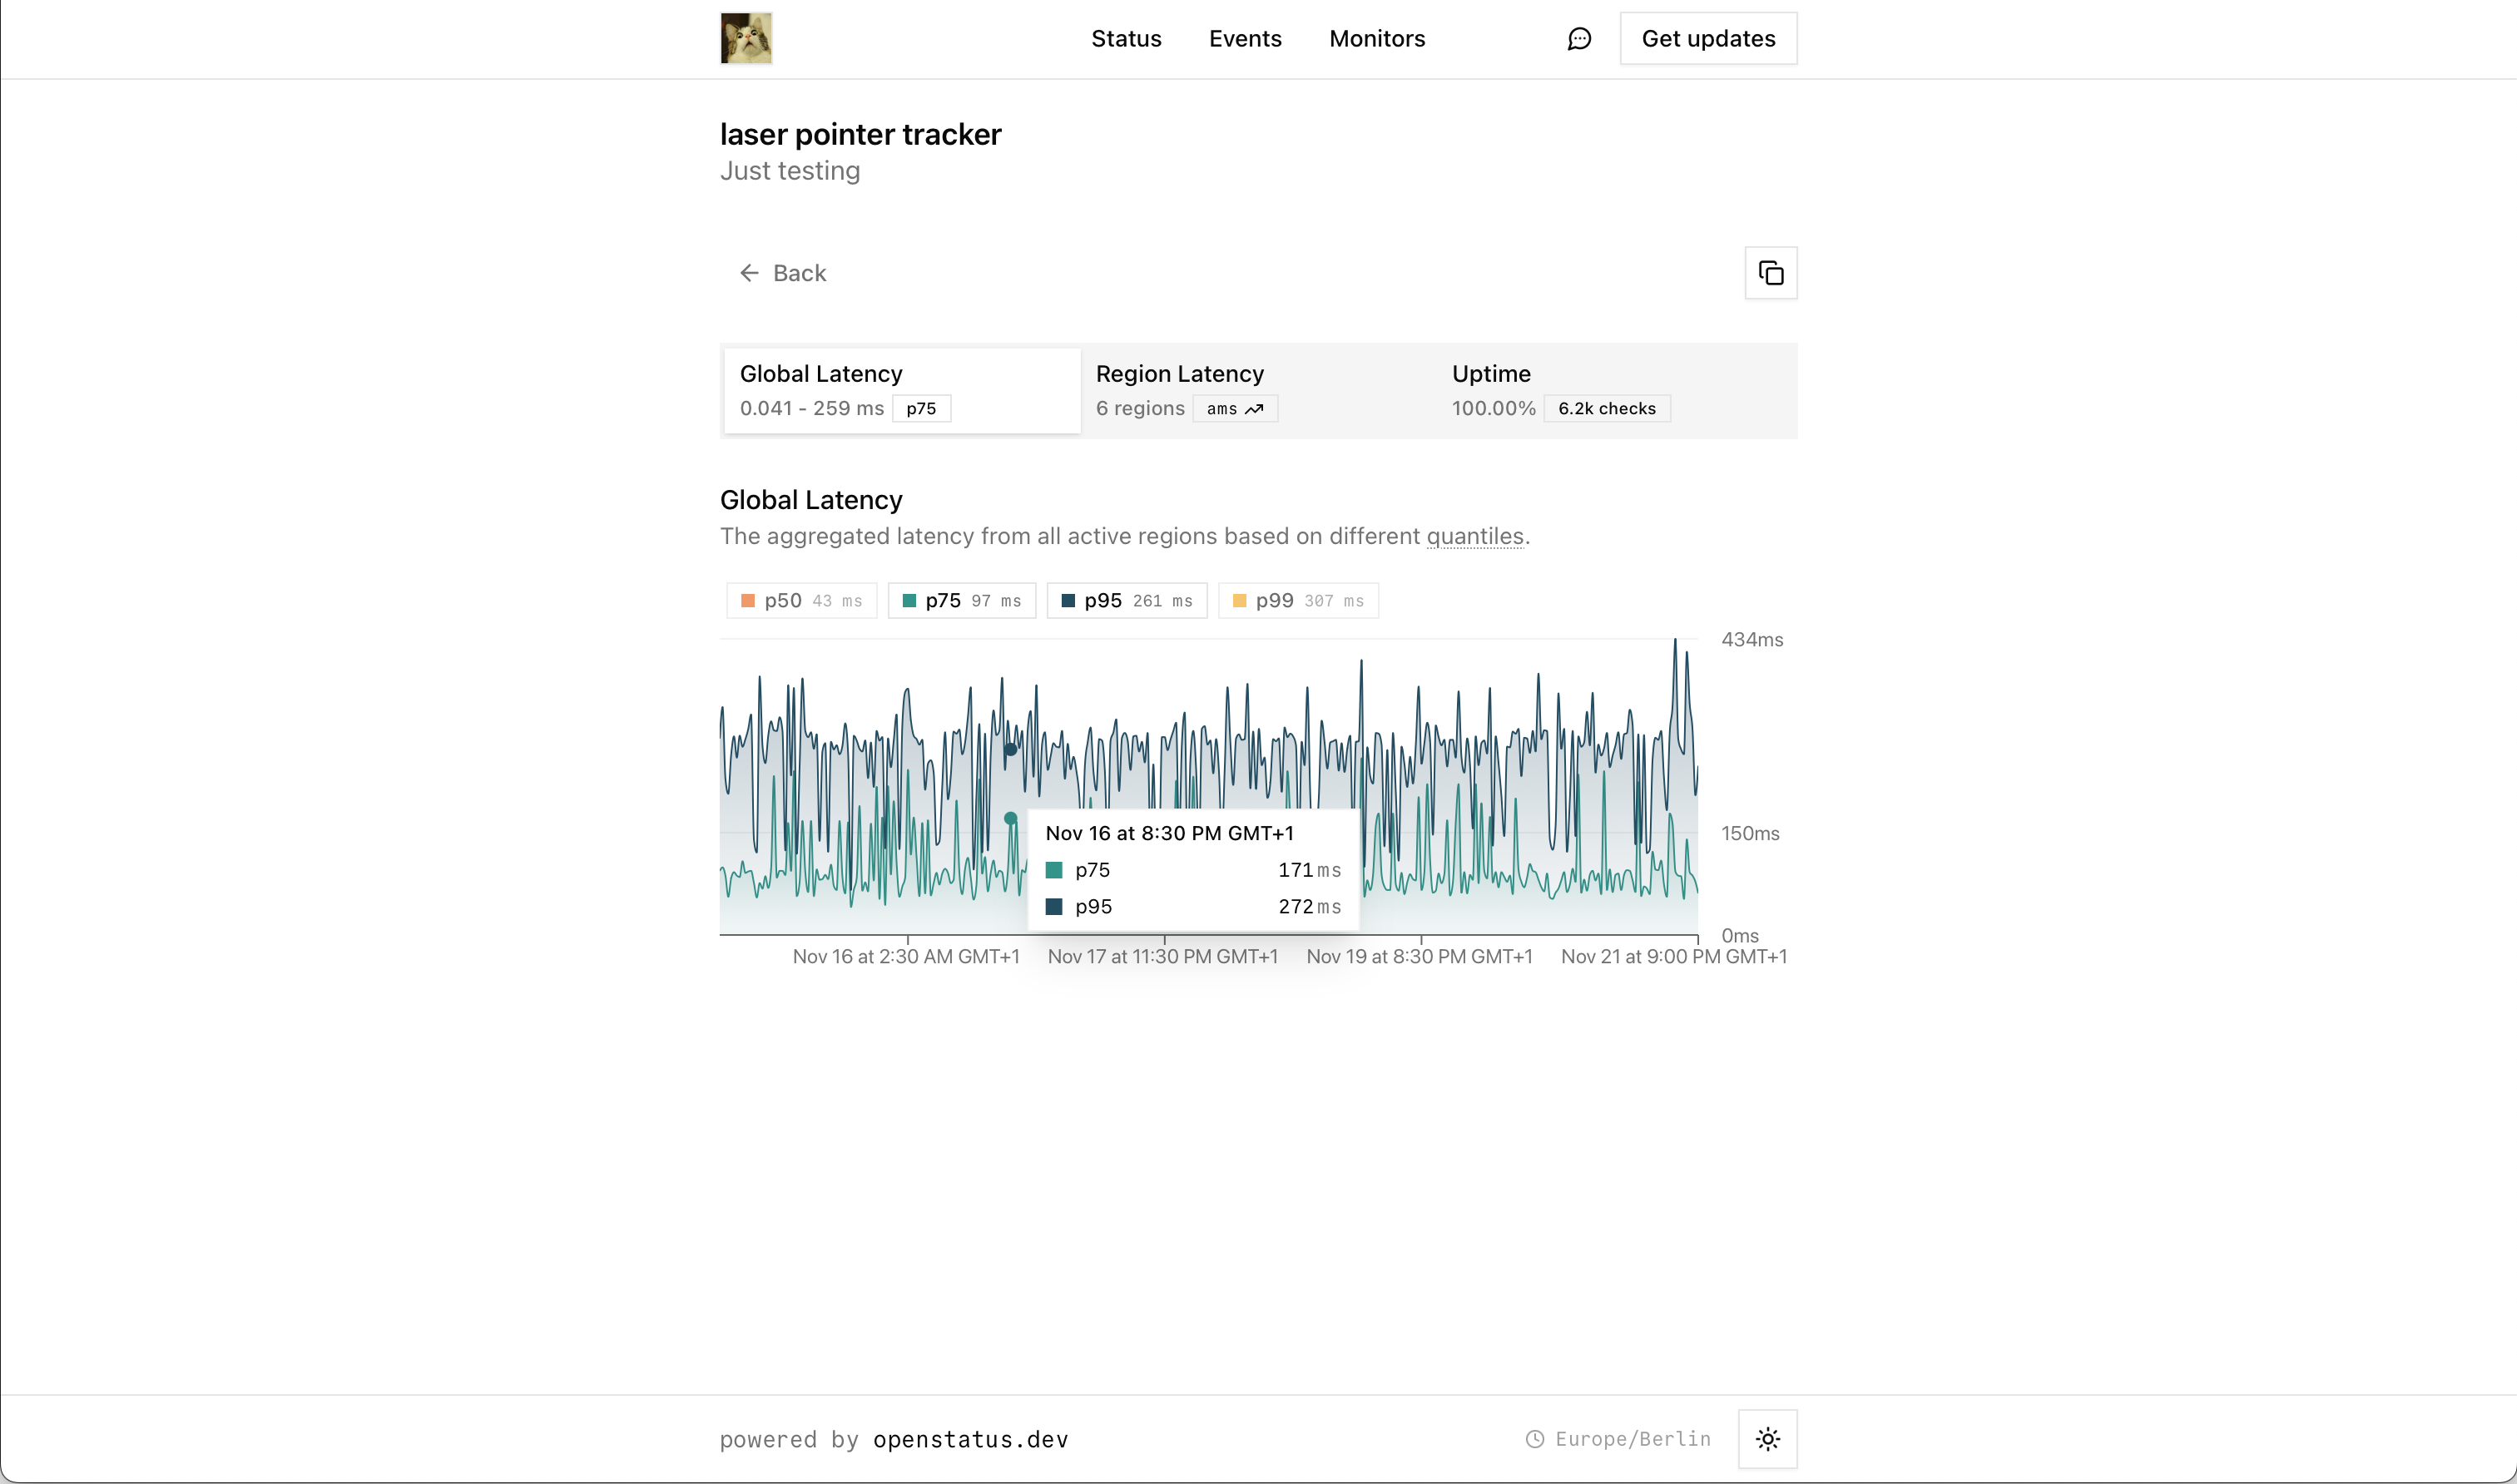
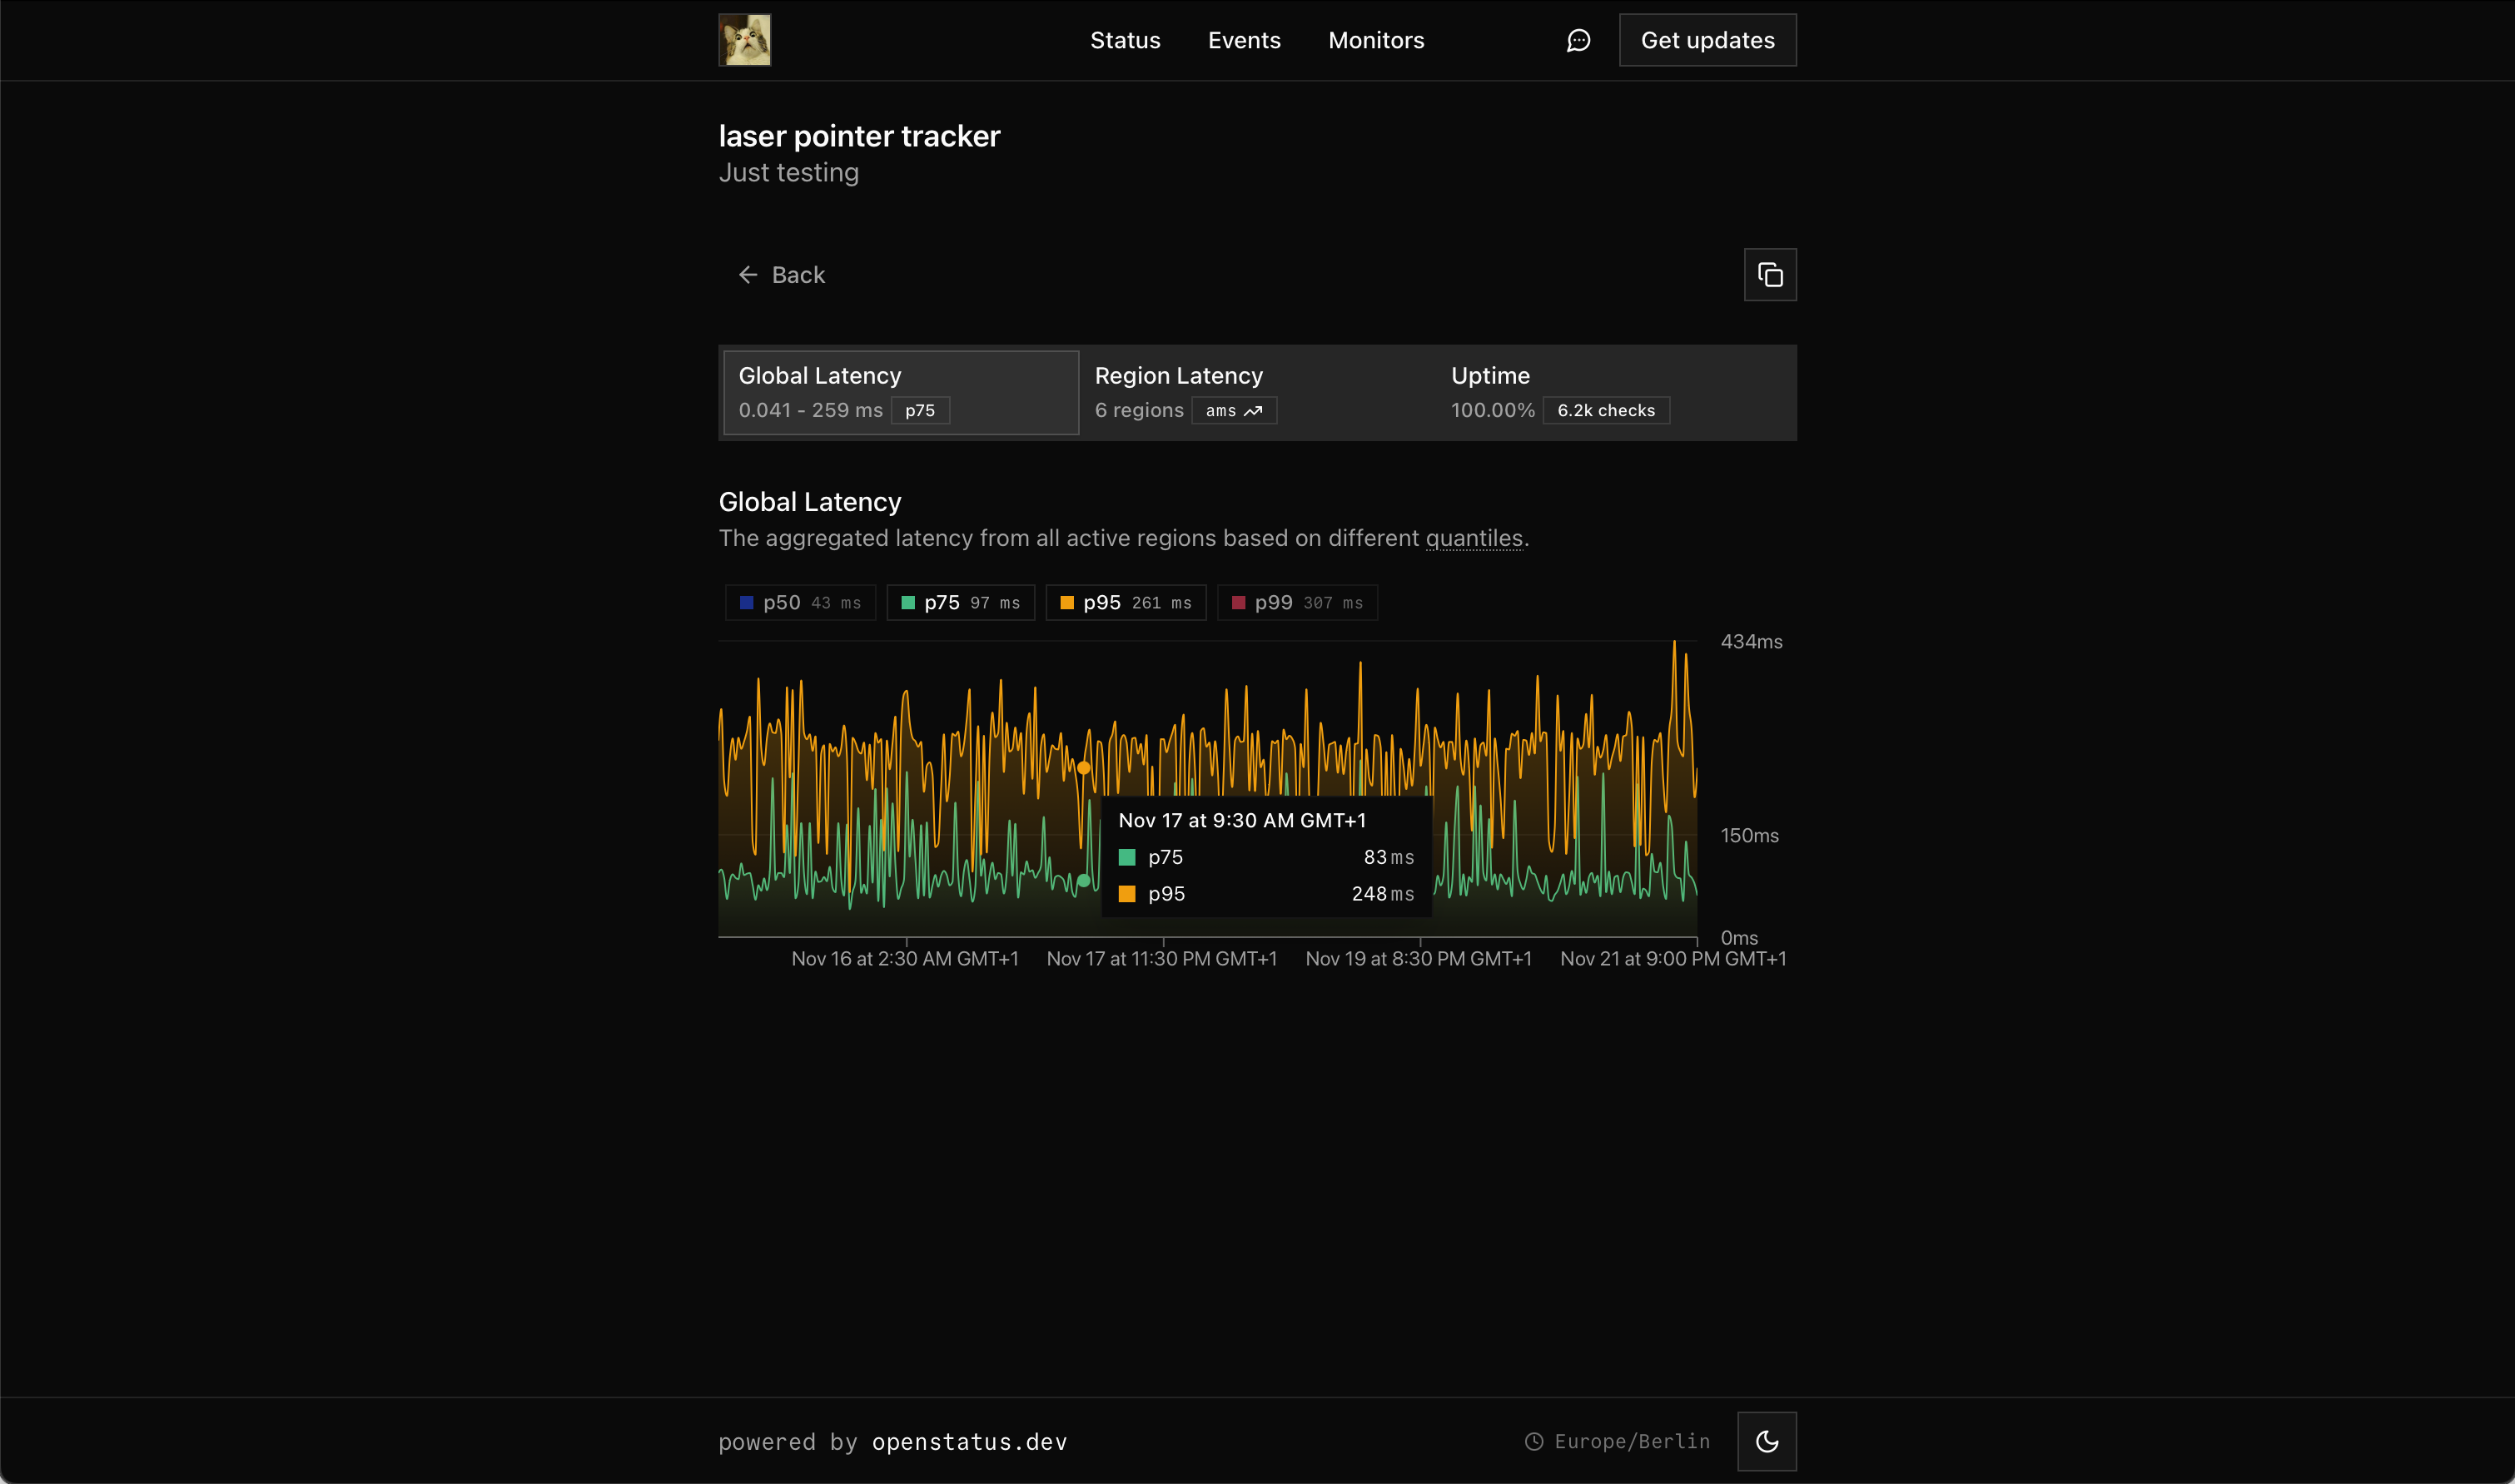
Uptime Dashboard


Response Logs


Why choose openstatus for uptime monitoring?
Global Monitoring
You can monitor your services from multiple regions around the world. We currently have our probes deployed in 28 regions.
Check all regions in the global speed checker.
Multi Cloud
You should avoid monitoring your services from the same cloud providers you use for those services. That’s why our probes are deployed across three different cloud providers:
- Fly.io
- Koyeb
- Railway
Notification channels
Set different notification channels and get notified whenever a not satisfying your assertions or are exceeding the thresholds.
We support:
- Socials: Slack, Discord
- Direct: Email, SMS
- Incident Management: OpsGenie, PagerDuty
- Custom: Webhook, Ntfy
Status Pages
Automatically update your status page based on your uptime monitoring results. Push reports and communicate with your users during incidents. You can choose to share response details on your status page. Read more about status pages.
CLI
You can manage or trigger your monitors via CLI. We provide a simple GitHub Action to run it in your CI/CD.
Monitoring as code
The best way to version your monitor changes is via the openstatus CLI and its YAML config. Additionally, we provide you a Terraform. Read more about monitoring as code
Status Page Monitors
Check your website's latency
Global Speed Checker